
Data Visualisation
R has a very wide range of functions and packages for visualising data. The chapters in this part start with plotting in R, from base graphics to ggplot2, and combining several plots into one figure. They then cover spatial data and maps, and heatmaps. Plots for multivariate data are covered alongside the analyses they come from.
Visualising multivariate data
Data with many variables per sample, such as the abundances of many species at each site, are usually visualised by reducing them to a few dimensions or by grouping similar samples. These plots are covered in the Multivariate and Other Methods part, with the analyses that produce them:
Visualising spatial data
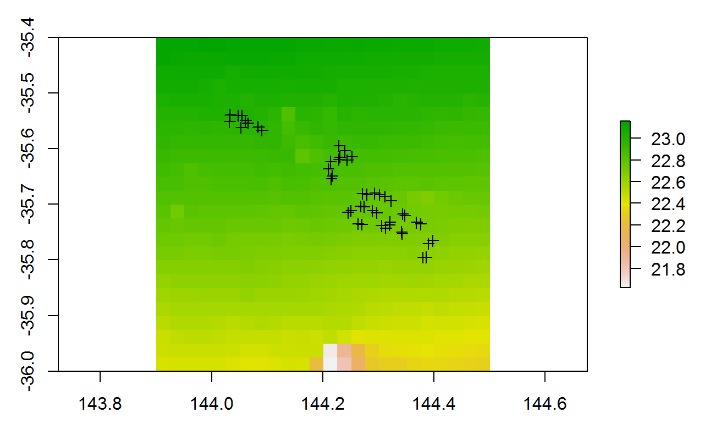
These chapters cover handling spatial data and making maps:
Chapters in this part
No matching items