Understanding Interactions
Sampling or experimental designs with more than one factor give us the opportunity to test whether the factors interact. An interaction between factors is when the effect of one factor is dependent on the conditions in the other factor. If there is no interaction, then the two factors are acting independently. When learning statistics, interactions make our lives a bit more difficult because we aren’t able to make simple statements about the main effects (each factor in isolation) - the observed results are due to factors acting in combination. It is very important to understand these, however, as we are often interested in whether various environmental variables act together to independently. Consider any of the following questions:
Does the effect of removing predators vary between habitats?
Does the effect of contamination vary with water temperature?
Does the effect of temperature vary with food supply?
Does the effect of nutrient pollution vary across soil types?
Do the benefits of establishing a reserve vary with reserve size?
These are all questions that would be answered by a formal statistical test of the interaction between factors.

Understanding interactions can be best understood visually. Let’s consider how the growth of coral may be affected by two very important stressors currently affecting the world’s oceans: increasing temperature and increasing acidification. An experimental design to test this could be one that grows corals in the laboratory in all combinations of several temperatures and several pH conditions.
For simplicity, let’s consider just two levels of each treatment: a control and warmed treatment for temperature and a control and acidified treatment for pH. Corals would be grown in all four combinations. These three plots for coral growth illustrate scenarios where the two factors of temperature and pH do not interact.
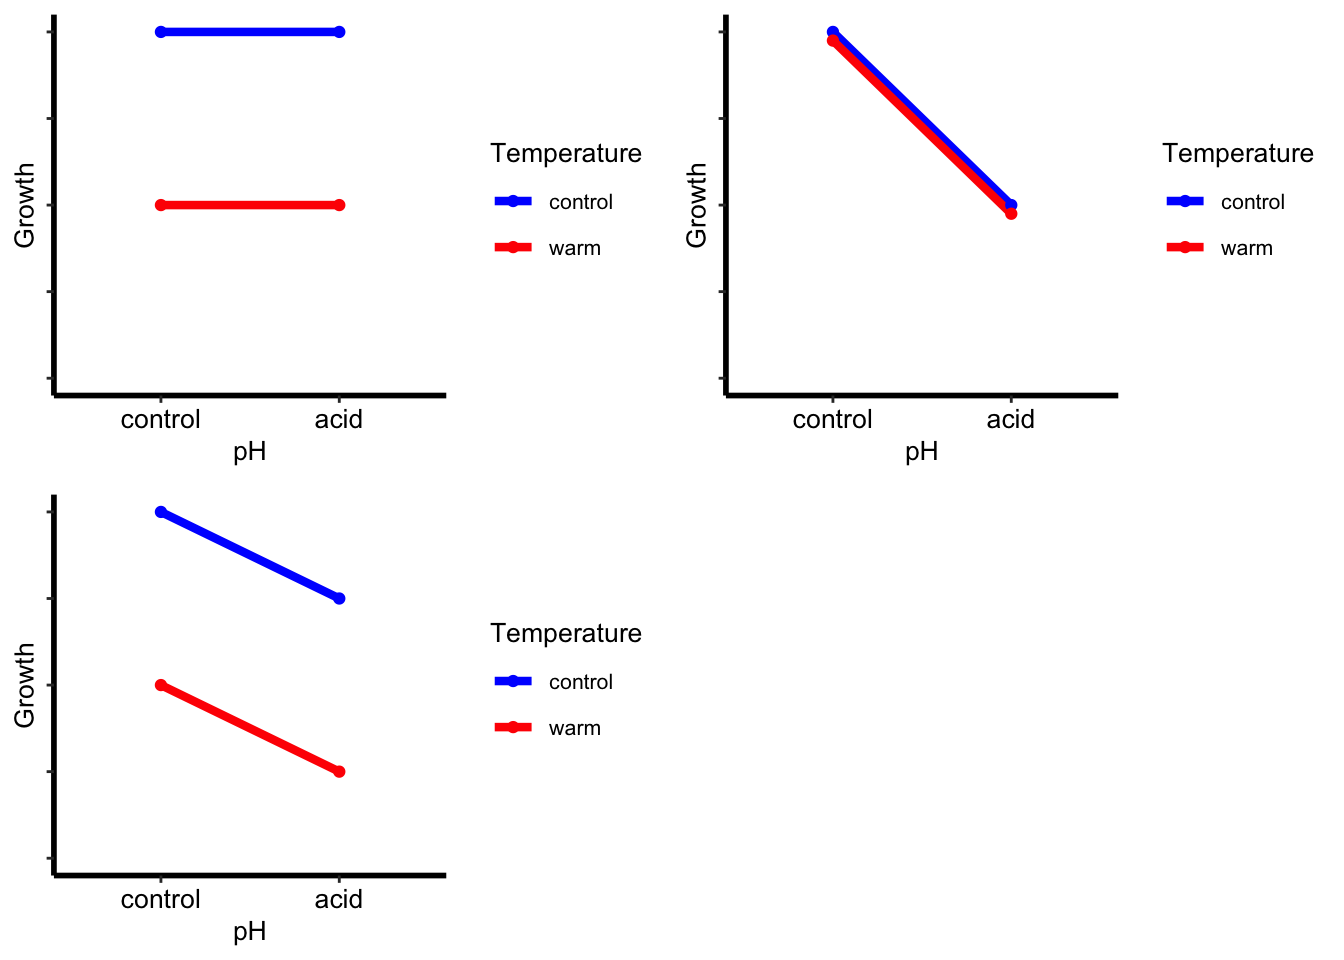
- In the top left figure, there is an effect of warming (growth reduced in the warmer treatment) and no effect of pH.
- In the top right figure, there is an effect of pH (growth reduced in the acid treatment) and no effect of warming.
- In the bottom figure, there is an effect of both temperature (growth reduced in the warmer treatment) and pH (growth reduced in the acid treatment).
The next three plots for coral growth illustrate scenarios where there is an interaction between the factors of temperature and pH.
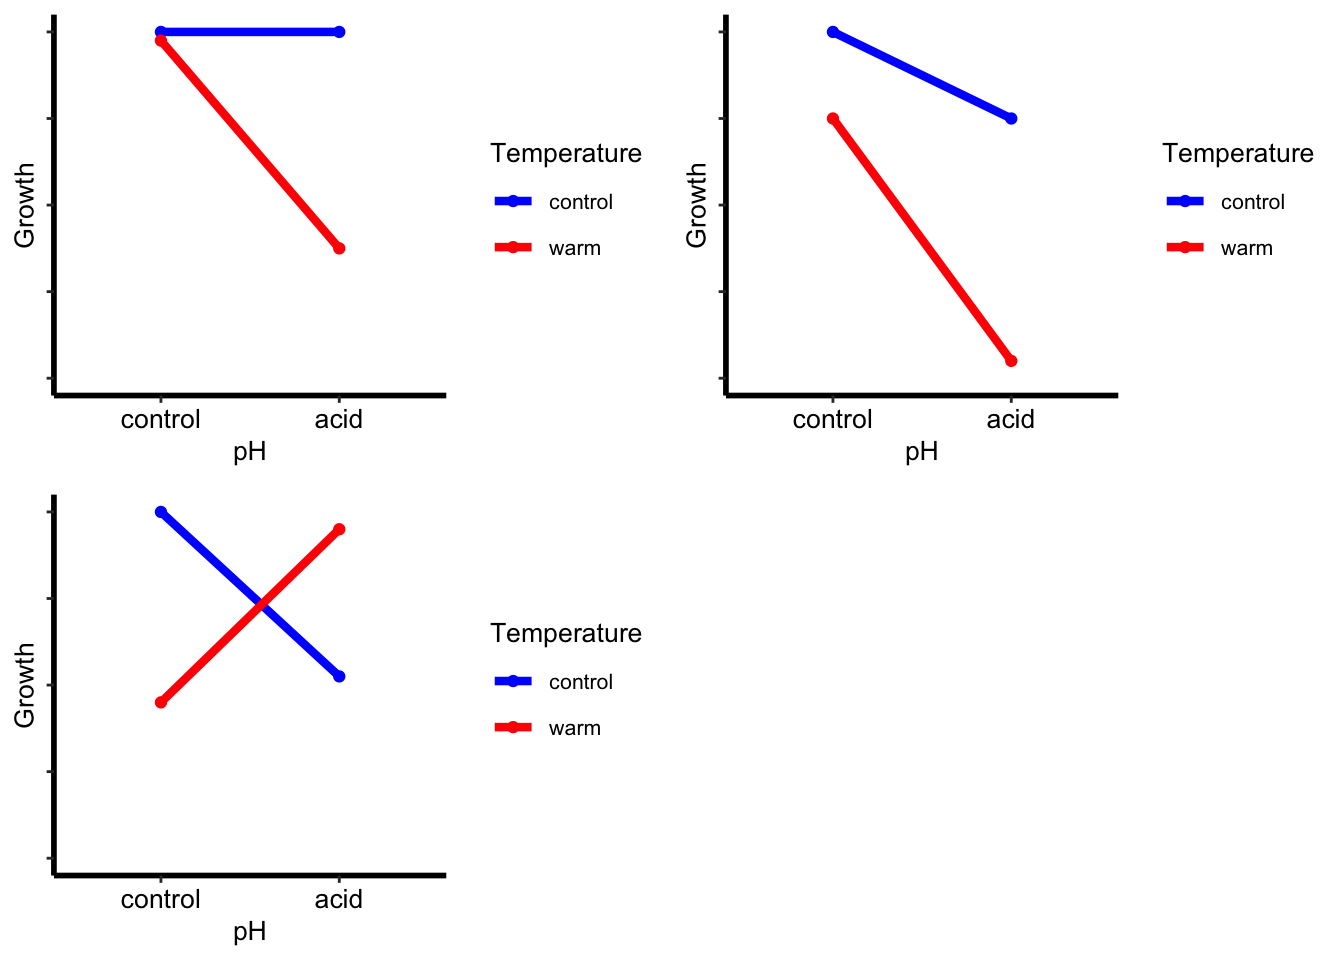
- In the top left figure, there is an effect of pH (growth reduced in the acid treatment) only in the warm treatment. The effect of warming is only evident in the acid pH treatment.
- In the top right figure, there is an effect of temperature (growth reduced in the warm treatment) and an effect of pH (growth reduced in the no effect of warming) but the effect of the acid treatment is greater in the warm treatment. The effect of warming is greater in the acid treatment.
- In the bottom figure, the effect of the acid treatment temperature completely changes in the two temperature treatments. Growth is reduced in the acid treatment in the control temperature, but increased in the warm temperature.
In all these cases with interactions, note that lines are not parallel (compare to the first three figures above).
The same ideas extend to sampling or experimental designs with more that two levels for each factor, and for designs where the predictor variables are continuous rather than categorical.
In this figure, there is an effect of pH (reduced growth in the acid treatment) in the warm and hot temperature treatments, but not the control temperature. Coral growth was always reduced in the hot treatment, but in the warm treatment, growth was slowed relative to the control only in the acid treatment.
Communicating results
Written. If you have significant interaction between two factors in your design, then communicating your results requires text that describes how the effects of one factor depend on the other. In the examples with interactions above, you could not simply say that “ocean acidification reduced the growth of corals” because this result varied across the temperature treatments.
In designs with categorical factors, post-hoc tests are commonly used to test which means differ from which (i.e., compare all four combinations of temperature and pH in the design above). The results from these can be placed in the text or onto figures to show which means differ from which. You would then have statistical support for statements that contrast particular treatments. A sentence for the results section for the top left figure in the interactions plots above would be something like “Temperature interacted with pH to affect the growth of corals (Table 1), with reduced growth in the warm treatment only (Fig. 1)” where Table 1 would hold the statistical details of the given test (e.g., factorial ANOVA).
Author: Alistair Poore
Year: 2016
Last updated: Feb 2022